The Analytics page tells you what readers do with your documentation: how many visits it gets, which pages they land on, what they search for, what they ask the AI assistant, and which pages have gone stale. It is organised into four tabs – Overview, Content, Performance and AI Insights – with a date-range selector in the top right.
How many of those four tabs you see, and how far back the date range goes, depends on your plan. See Analytics by plan for the full breakdown.
The date range selector
The dropdown beside the refresh button controls the window every card is calculated over: Last 30 Days, Last 60 Days, Last 3 Months and Last 6 Months. Only the ranges your plan allows appear in the list; the longer ones carry a Premium tag.
The circular arrow button next to it refetches everything for the current range.
Overview tab
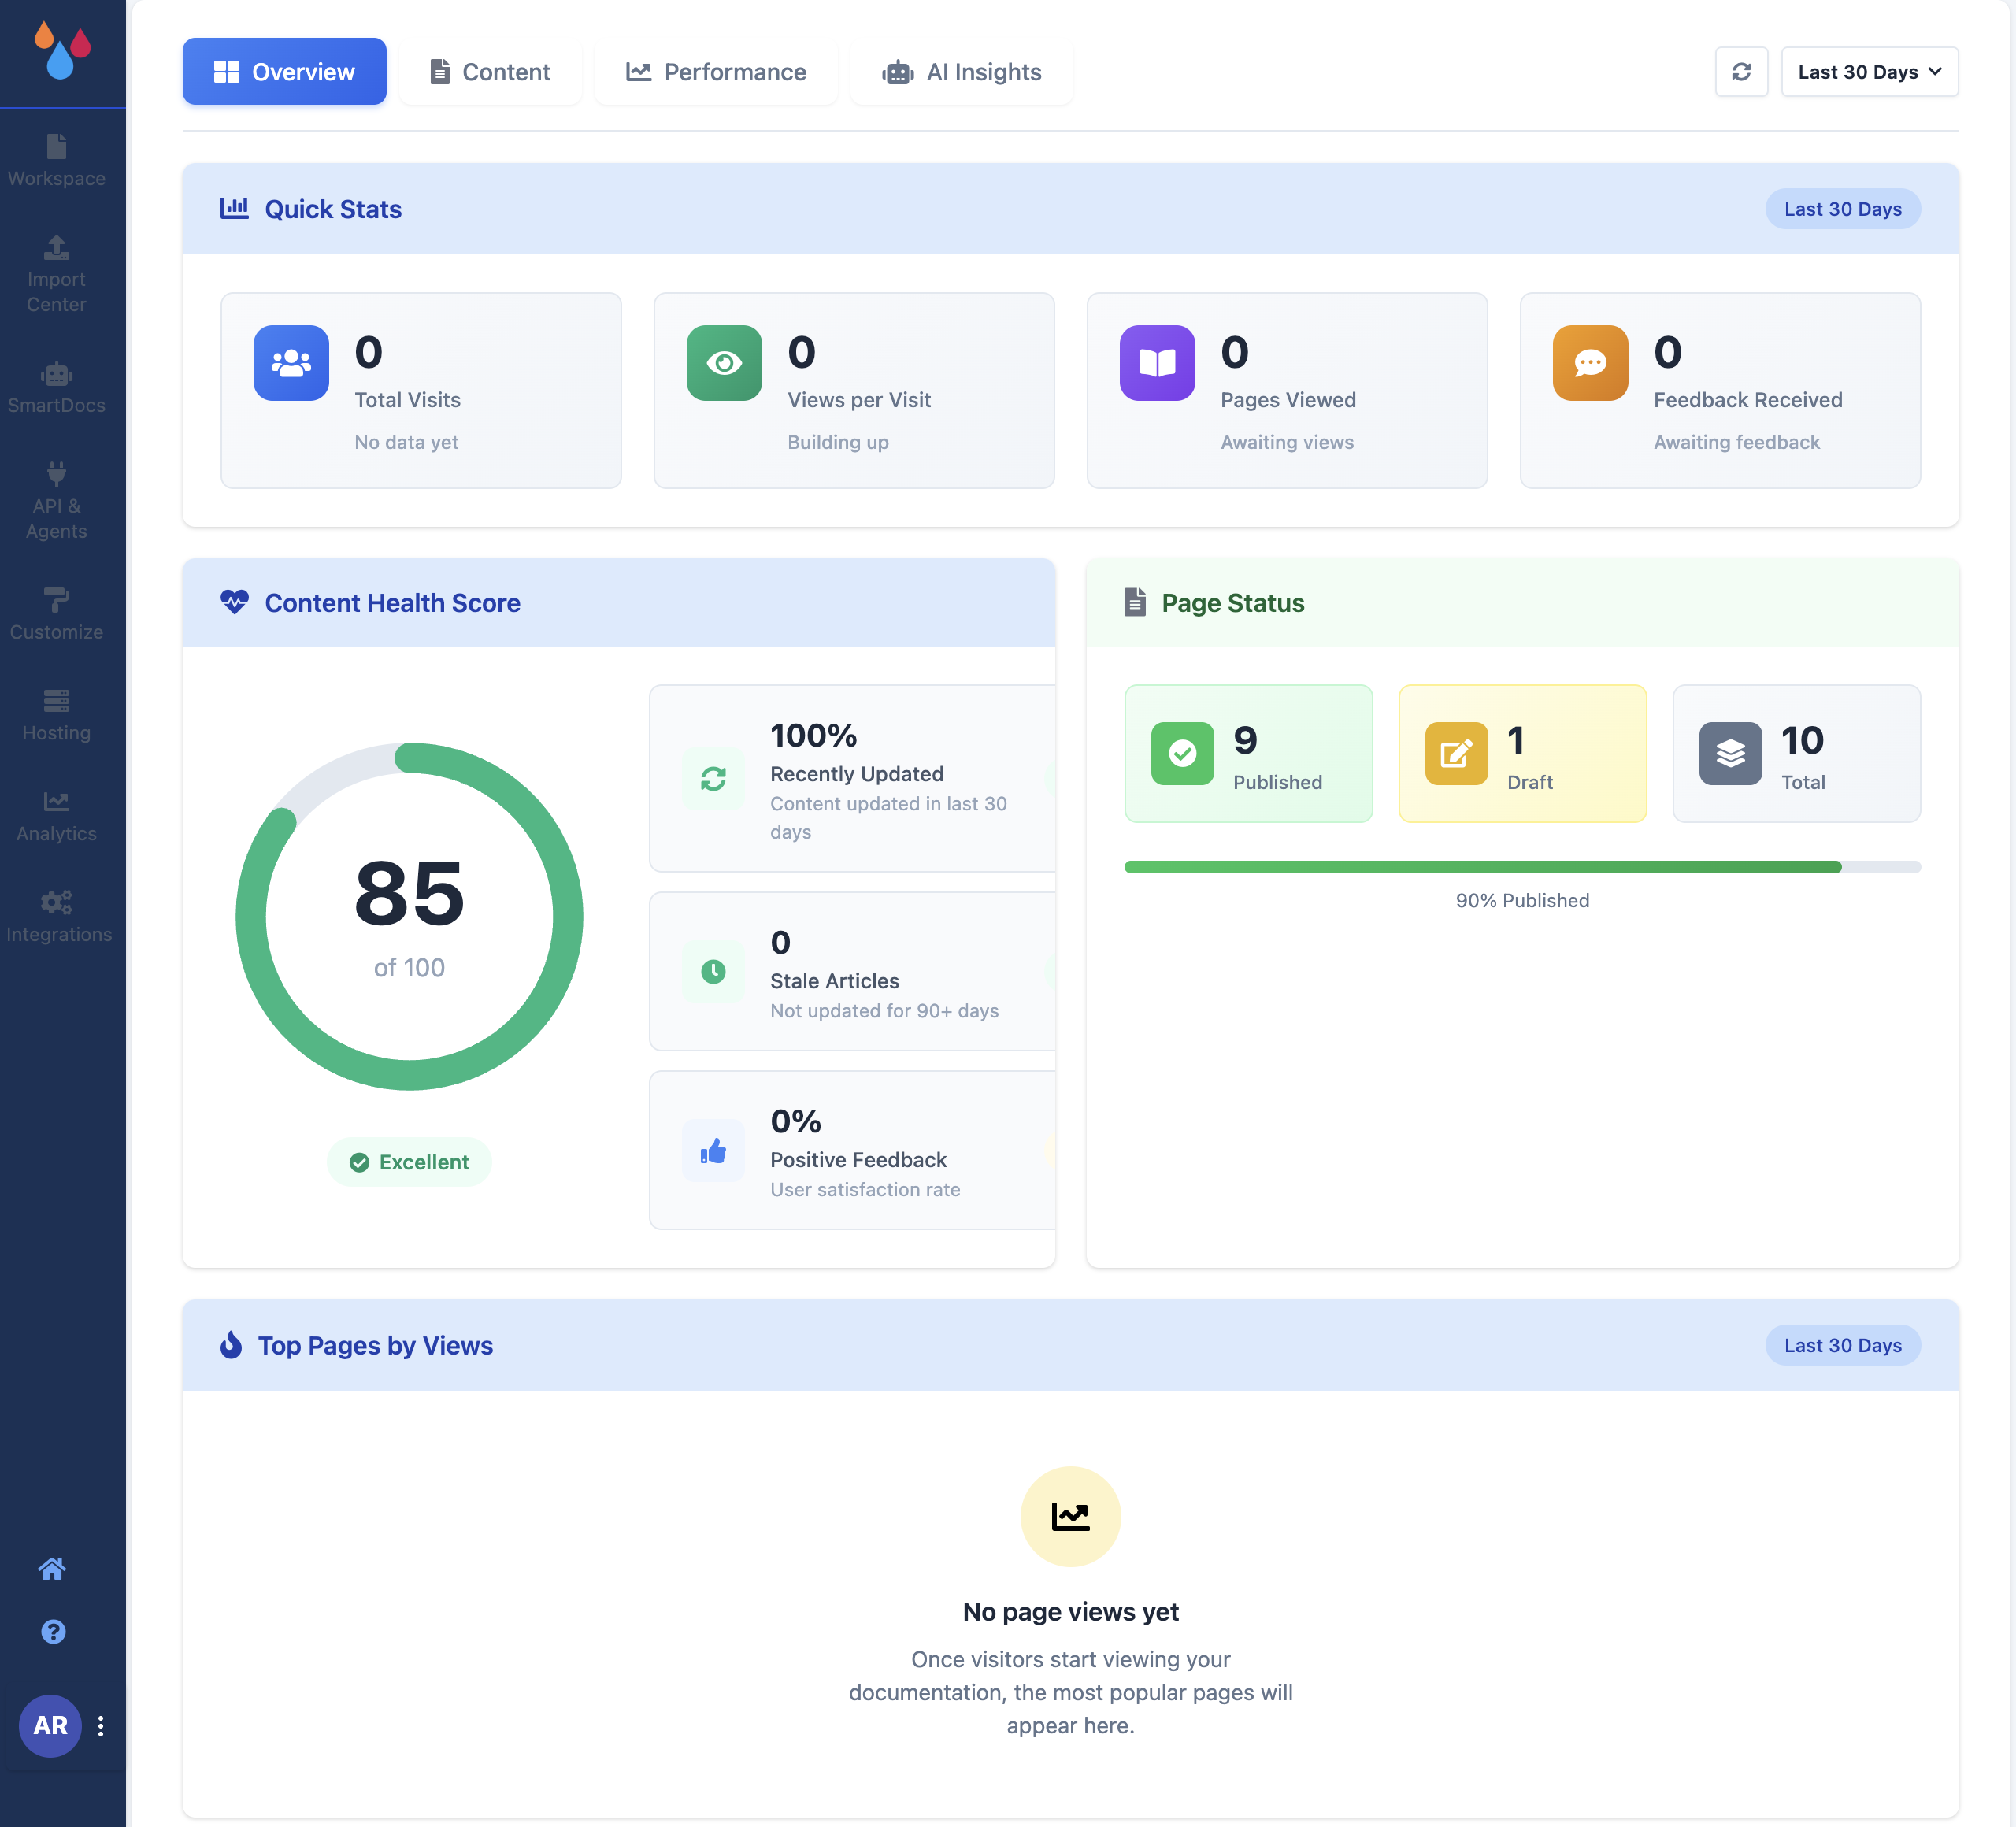
Overview answers "is anyone reading this, and is it healthy?"
- Quick Stats – four numbers for the selected range: Total Visits, Views per Visit, Pages Viewed and Feedback Received.
- Content Health Score – a single score summarising the state of your documentation.
- Page Status – how your pages break down by publication status.
- Top Pages by Views – your most-viewed pages over the selected range.
- Stale Content Alert – a list of pages that have not been updated in a long time. This card only appears when there is something stale to report.
Where the traffic numbers come from
Total Visits, Views per Visit, Pages Viewed and Top Pages are measured against your site's public hostname by Google Analytics. They start at zero on a new site and stay there until it has had visitors and the data has propagated – usually about a day. Content Health Score, Page Status and Stale Content read your own pages, so those are right immediately.
Content tab
Content is about what readers are looking for and whether they find it.
- Search Analytics – Total Searches, Unique Queries and Click-through Rate, plus a Top Searched Terms list. The queries with no click-throughs are the interesting ones: they are questions your documentation does not answer well.
- Collection Performance – the same engagement figures rolled up per collection, so you can see which sections carry the traffic.
- Page Performance – splits your pages into Most Accessed and Not Accessed over the selected window. The "Not Accessed" list is the candidate list for pruning or promoting.
Performance tab
- Content Performance – groups pages into those doing well and those needing attention. When pages need attention, the tab label carries a count badge so you see it without opening the tab.
- Feedback Distribution – a chart of the thumbs-up and thumbs-down responses readers leave through the "Was this page helpful?" prompt, with a toggle between the selected range and all time.
AI Insights tab
AI Insights covers your SmartDocs assistant, so it is only meaningful once SmartDocs is switched on and trained.
- AI Assistant Analytics – Total Conversations, Avg. per Day, Avg. Response Length and Unanswered Rate. Unanswered rate is the one to watch: it is the share of questions your trained documentation could not answer.
- AI Query Keywords – Most Common Topics extracted from what readers asked, which reads as a to-do list for pages you have not written yet.
Where the numbers come from, and how fresh they are
Visit and page-view figures – Quick Stats, Top Pages by Views, and the traffic parts of the Content and Performance tabs – come from Google Analytics, which Dewstack runs against your published docs site. Dewstack caches each Google Analytics response for 30 minutes, so numbers are not live: a visit that happened a minute ago will not show up until the cache expires, and clicking refresh inside that window returns the same figures.
Everything else is read directly from your workspace and updates immediately: page status, content health, feedback, search queries and AI conversations.
Two consequences worth knowing:
- Traffic totals here will not match your own Google Analytics property exactly. Different measurement, different processing windows.
- Analytics only counts readers on your published docs site. Previewing a page in the dashboard does not register a visit.
If the page cannot load its data it shows Unable to Load Analytics with a Try Again button; that is a fetch failure, not a plan restriction.